By The Charge Cycle Editorial Team · January 5, 2026
Introduction
T he global economy has arrived at a definitive fork in the road. The choice is no longer between profitability and the planet; it is between evolving with Sustainable Technology Trends 2026 or facing industrial obsolescence.
Sustainable technology—once relegated to the periphery of “Corporate Social Responsibility”—has migrated to the core of global strategy. In 2026, it is not an ideal; it is an imperative.
For the first time in history, global investment in clean energy technologies has surged past fossil fuel spending, reaching an estimated $2.4 trillion¹. Solar arrays, wind farms, gigafactories, and smart grids have become the new backbone of infrastructure, driving employment and competitiveness while hardening our systems against climate volatility.
Yet, the transition is asymmetric. Millions remain without reliable electricity², and capital flows remain heavily concentrated in wealthy nations¹ ³. This guide serves as a strategic roadmap for the founders, investors, and policymakers bridging this divide.
Defining the Sector
Sustainable technology is not a single vertical; it is an operational philosophy. It encompasses any innovation that generates economic value while preserving the natural systems that underpin society.
It serves a Dual Mandate:
- Decarbonization (The Offensive Strategy): Aggressively lowering greenhouse gases, waste, and pollution to stop the damage.
- Resilience (The Defensive Strategy): Fortifying systems against climate disruption to ensure stable, inclusive growth even when shocks occur.
In 2026, this manifests as utility-scale solar farms replacing coal plants, AI-driven logistics slashing fuel burn, and digital passports tracking products from extraction to recycling

The Four Pillars of Transition
These four enablers provide the “How” of the global energy transition.
1. Digital Force Multipliers (The Backbone)
Digitalization is the nervous system of the green economy. By integrating real-time monitoring with decision-making frameworks, digital tools act as “impact multipliers.” They identify efficiencies that human operators miss and accelerate the optimization of complex systems, ensuring that every kilowatt-hour produced is utilized effectively.
2. The AI Optimization Engine (The Brain)
Artificial Intelligence has graduated from hype to utility. It is now the “brain” of energy management:
- Grid Intelligence: Forecasting renewable generation with hyper-local precision.
- Logistics: Dynamic routing that shaves percentage points off global fuel consumption.
- Green AI: As compute demands rise, the industry is pivoting to efficient algorithms running on data centers powered exclusively by renewables.
3. IoT: The Eyes and Ears (The Nerves)
While AI provides the intelligence, the Internet of Things (IoT) provides the sensory input. Millions of connected devices—from soil moisture probes in the Punjab to vibration sensors in German factories—allow operators to shift from reactive repairs to predictive maintenance, drastically reducing waste and downtime.
4. The Capital Shift (Finance & Policy)
Finance is the fuel, but Policy builds the engine. With clean energy investment hovering around $2.4 trillion annually, capital markets are aggressive¹. Instruments like Green Bonds are standardizing, while government policies (like the US Inflation Reduction Act or EU Carbon Border Tax) de-risk these investments. This regulatory “floor” allows the other three pillars to scale by making sustainability the financially prudent choice.
Why 2026 is the Tipping Point
- The Capital Flip: For every $1 spent on fossil fuels, nearly **$2 is now spent on clean technologies¹.
- Scale: Global renewable capacity has breached 4.8 terawatts—a staggering milestone³
- Data Integrity: Regulatory pressure is forcing companies to move from marketing claims to verifiable data, sparking a boom in ESG software.
The 15 Categories Redefining Industry
| S. No. | Category | Current Position |
| 1 | Solar Energy | Largest single clean-investment segment. Utility, rooftop, and agrivoltaics dominate growth. |
| 2 | Wind Power | Onshore steady; offshore (incl. floating) rising. Diversifies away from solar-only systems. |
| 3 | Battery & Energy Storage | Heavily invested upon. Crucial for balancing variable renewables. |
| 4 | Green Hydrogen | Electrolyser capacity rapidly expanding.¹Decarbonizes industry, shipping, and fertilizers. |
| 5 | Smart Grids | Heavily Invested upon. AI-enabled networks manage two-way flows. |
| 6 | Sustainable Agriculture | Precision tech and regenerative methods scaling. Links climate, food security, and livelihoods. |
| 7 | Water & Desalination | Growing in MENA and stressed regions. Focus on efficiency, reuse, and solar desalination. |
| 8 | Waste-to-Value Systems | Municipal and industrial projects expanding. Waste becomes a resource for fuels and materials. |
| 9 | Carbon Capture & Utilization | DAC and point-source pilots increasing. Addresses hard-to-abate sectors. |
| 10 | Electric & Hydrogen Mobility | EV sales and charging networks rising. ⁴ Public transit and fleet transitions are key. |
| 11 | Green Construction & Materials | Retrofits and low-carbon concrete growing. Urban decarbonization opportunity. |
| 12 | Circular Economy Platforms | Policy-driven (e.g. EU product passports). Digital tools extend product life and recovery. |
| 13 | Environmental Monitoring & Analytics | Satellite + AI monitoring maturing. Underpins climate risk and MRV. |
| 14 | ESG & Sustainability Software | Booming due to new regulations. Automates disclosures and performance tracking. |
| 15 | Clean Manufacturing | Digital twins, robotics, and efficient drives. Cuts energy, scrap, and downtime. |
Top 50 Global Innovators in Sustainable Technology (2025)
1. Renewables & Storage
| Org | Location | Short Conclusion |
| Ørsted | Denmark | Global offshore-wind pioneer, now combining wind with green hydrogen. |
| First Solar | USA | Thin-film solar modules with the lowest lifecycle carbon footprint. |
| Huasun Energy | China | High-efficiency HJT solar cells supplying parks across Europe/Asia. |
| Tesla Energy | USA | Megapack systems and VPP software helping grids absorb renewables. |
| Form Energy | USA | Iron-air batteries solving the long-duration storage challenge. |
2. Circular Economy & Recycling
| Org | Location | Short Conclusion |
| TerraCycle | USA | Global recycling programs for hard-to-recycle wastes. |
| Redwood Materials | USA | Recovering lithium/cobalt from EV batteries for the supply chain. |
| AMP | USA | AI robotic arms for high-accuracy recycling sorting. |
| [suspicious link removed] | USA | Plant-derived coatings extending food shelf life to cut waste. |
| Geno | USA / EU | Bio-based polymers replacing fossil-fuel plastics. |
3. Agriculture & Food Systems
| Org | Location | Short Conclusion |
| Indigo Ag | USA | Regenerative ag support and biological seed coatings. |
| Regrow Ag | Global | MRV platforms quantifying soil health and emissions. |
| Pivot Bio | USA | Microbial nitrogen replacing synthetic fertilizers. |
| CropX | India | IoT soil sensors for precision irrigation in stressed regions. |
| Ecorobotix | Switzerland | AI-guided weeding robots cutting chemical use by 90%. |
4. Green Buildings & Infrastructure
| Org | Location | Short Conclusion |
| Schneider Electric | France / Global | Microgrids and automation for net-zero operations. |
| Johnson Controls | USA | Efficient HVAC and building automation platforms. |
| Turntide Technologies | USA | High-efficiency motor systems for HVAC and mobility. |
| Saint-Gobain | France / Global | Low-carbon construction materials and glass. |
| View Inc. | USA | Smart-glass systems reducing glare and cooling loads. |
5. Mobility & Transport
| Org | Location | Short Conclusion |
| BYD | China / Global | Massive global supplier of EVs, trucks, and electric buses. |
| Rivian | USA | Electric trucks/vans focusing on fleet decarbonization. |
| NIO | China | Battery-swap stations and smart EV services. |
| Lucid Motors | USA | High-efficiency luxury EVs setting range records. |
| Proterra | USA | Electric buses and charging for public transit agencies. |
6. Water & Desalination
| Org | Location | Short Conclusion |
| Xylem | USA | Smart water solutions and leak detection. |
| Energy Recovery Inc. | USA | Pressure-exchange devices cutting desalination energy costs. |
| Aquatech | USA | Industrial water reuse and zero-liquid discharge systems. |
| Veolia | France / Global | Large-scale water treatment and resource recovery. |
| IDE Technologies | Israel | Desalination plants integrated with renewable power. |
7. Carbon Management & CCUS
| Org | Location | Short Conclusion |
| Climeworks | Switzerland | Direct Air Capture (DAC) removing atmospheric CO2. |
| Carbon Clean | UK / India | Modular CO2 capture for industrial emitters. |
| Svante | Canada | Solid-sorbent capture for flue gases. |
| Verdox | USA | Electro-swing adsorption for efficient CO2 capture. |
| Newlight Technologies | USA | Converts greenhouse gases into biomaterials (AirCarbon). |
8. Advanced Materials & Industry 4.0
| Org | Location | Short Conclusion |
| Covestro | Germany | Circular and bio-based polymers for industry. |
| Umicore | Belgium | Battery recycling and metal refining. |
| Heliogen | USA | AI-controlled solar concentration for industrial heat. |
| Bloom Energy | USA | Solid-oxide fuel cells for reliable low-carbon power. |
| QuantumScape | USA | Solid-state batteries for next-gen EVs. |
9. Finance & ESG Platforms
| Org | Location | Short Conclusion |
| BlackRock | Global | Integrating climate risk into asset management. |
| Persefoni | USA | Software for carbon accounting and reporting. |
| Climate Impact X | Singapore | Marketplace for high-integrity carbon credits. |
| Sustainalytics | Netherlands / Global | ESG risk ratings and research. |
| CDP (Carbon Disclosure Project) | UK / Global | The world’s largest environmental disclosure system. |
10. Public Sector & Policy Leaders
| Org | Location | Short Conclusion |
| UN Environment Programme (UNEP) | Global | Coordinating international climate and pollution efforts. |
| International Energy Agency (IEA) | Global | Energy investment reports shaping transition pathways¹. |
| International Renewable Energy Agency (IRENA) | Global | Renewable capacity tracking and roadmaps³. |
| World Bank | Global | Financing climate-resilient infrastructure⁵. |
| UNFCCC | Global | Managing global climate negotiations and NDCs⁶. |
Implementation Roadmaps by Industry
| Industry | Past State (Pre-2026) | Current State (2026) | Future State (2027–2030) |
| Energy | Fossil fuel baseload; limited renewables. | Hybrid grids; smart sensors; efficiency focus. | Zero-carbon grids; green hydrogen; digital management. |
| Transportation | ICE dominance. | EV fleet adoption; route optimization AI. | Fully electric/hydrogen; smart logistics minimizing emissions. |
| Agriculture | Chemical-heavy; low efficiency. | Precision sensors; regenerative methods. | Carbon-neutral supply chains; vertical farming. |
| Water & Waste Management | High leakage; untreated waste. | Leak detection; water recycling. | Circular water systems; AI-managed efficiency. |
| Manufacturing | High emission intensity. | Automation; cleaner fuels. | Net-zero factories; robotics; sustainable materials. |
| Buildings | Inefficient systems. | Smart HVAC; LED lighting. | Net-zero buildings; integrated solar; automated energy. |
Regional Investment Patterns
(Based on open data from IEA, IRENA, and UN sources: ¹ ² ³)
| Region | Key Progress | Key Challenges |
| China | 65% of new global renewable additions⁶. | Grid congestion and curtailment. |
| United States | Massive solar capacity growth⁴. | Transmission bottlenecks; permitting delays. |
| Europe | Clean investment outpaces fossil 12:1¹. | Regulatory complexity; local opposition. |
| Africa | Only ~2% of global clean investment¹. | High cost of capital; grid limits. |
| India | Rapid progress toward 50% non-fossil power¹. | Balancing growth with coal phase-down. |
| Brazil & Latin America | Strong hydro/wind resources¹. | Policy uncertainty slows decisions. |
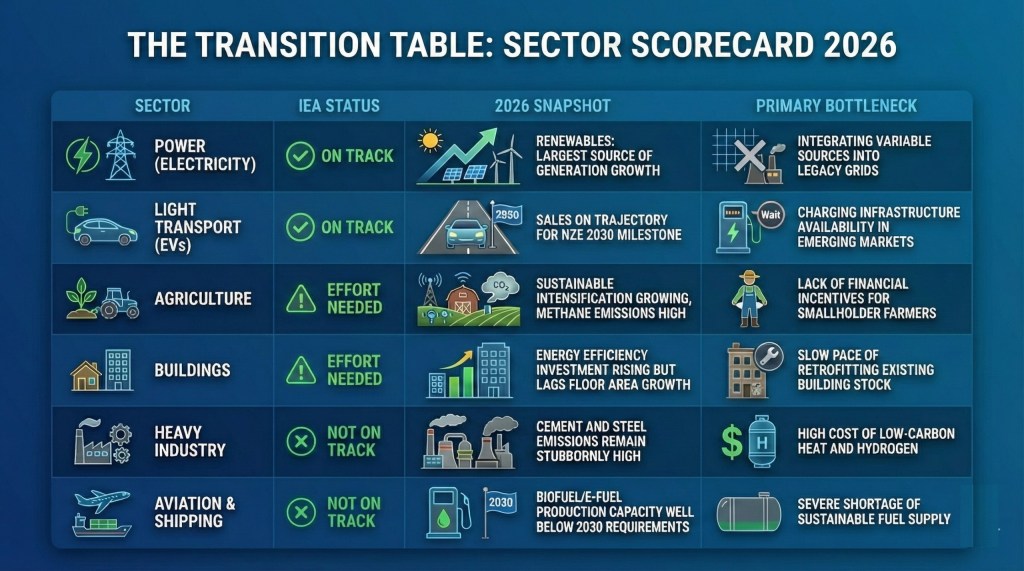
The Scorecard & Gap Analysis
II. The Transition Table (Sector Scorecard)
Progress against Paris Agreement 1.5°C pathways.
III. The Investment Table (Public Sector Data)
Source : IEA World Energy Investment (2025 Release) & IRENA World Energy Transitions Outlook.

The Outlook: 2027–2030
As we look toward the latter half of the decade, five macro-trends will define the market:
- Hydrogen & e-Fuels: Hard-to-abate sectors like aviation and heavy shipping will increasingly turn to green hydrogen.
- Grid Modernization: The focus will shift from generating power to moving and storing it, with transmission infrastructure becoming the hot asset class.
- Digital Twins & MRV: We will see the mass adoption of digital modeling to test scenarios before construction, alongside automated Measurement, Reporting, and Verification (MRV) to validate climate claims.
- Circular Design: Products will be designed for disassembly from day one, with bio-based alternatives entering the mainstream.
- Policy Convergence: Climate finance and industrial policy will merge into a single, integrated agenda.
Conclusion
The rapid acceleration of sustainable technology in 2026 is not just a trend; it is the new industrial reality. The metrics are clear: clean energy investment is outpacing fossil fuels¹, and renewable capacity is breaking records³.
However, the “deployment gap” remains the central challenge. The technology to save the planet largely exists; the objective for the next decade is velocity. We must scale these solutions, unclog infrastructure bottlenecks, and democratize access to capital. The winners of the next decade will not just be those who innovate, but those who execute at scale.
References, Attributions & Legal Disclaimers
- [1] IEA (2026). World Energy Investment 2026. International Energy Agency. License: CC BY 4.0. [https://www.iea.org/reports/world-energy-investment-2026]
- [2] United Nations. The Sustainable Development Goals Report 2026. UN Department of Economic and Social Affairs.
- [3] IRENA (2026). Renewable Capacity Statistics 2026. International Renewable Energy Agency, Abu Dhabi.
- [4] EIA (2026). Annual Energy Outlook 2026. U.S. Energy Information Administration.
- [5] World Bank (2026). State and Trends of Carbon Pricing 2026. The World Bank: Carbon Pricing Dataset. License: CC BY 4.0.
- [6] UNFCCC. NDC Registry. United Nations Framework Convention on Climate Change.
Legal & Reference Disclaimers
1. Data Attribution & Liability
This article is a work derived by Charge Cycle from public open data sources including the IEA, UN, IRENA, and World Bank. This is a work derived by Charge Cycle from IEA material and Charge Cycle is solely liable and responsible for this derived work. The derived work is not endorsed by the IEA in any manner.
2. No Financial or Investment Advice
The information provided in this article regarding market trends, investment gaps, and specific companies is for informational purposes only and should not be construed as financial or investment advice. Charge Cycle is not a registered investment advisor. Readers should conduct their own research and consult with a qualified financial professional before making any investment decisions
3. Accuracy and Forward-Looking Statements
While every effort has been made to ensure the accuracy of the data presented, the sustainable technology sector is fast-evolving. This article contains forward-looking statements and projections for 2027–2030 based on current data; actual results may differ materially. The publisher makes no representations or warranties about the completeness, reliability, or suitability of the information contained herein.
4. Copyright & Trademarks
Company names and logos mentioned in the “Top 50 Global Innovators” tables remain the property of their respective owners and are included here for educational and informational identification purposes only.
5. Limitation of Liability
Charge Cycle is not responsible for any losses or damages (financial or otherwise) that may result from reliance on the information contained in this article.